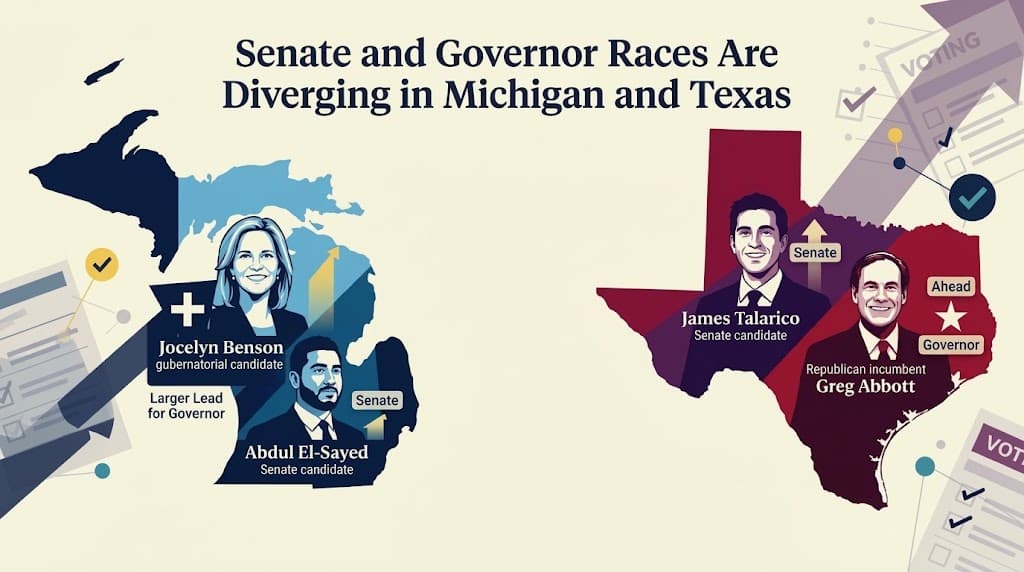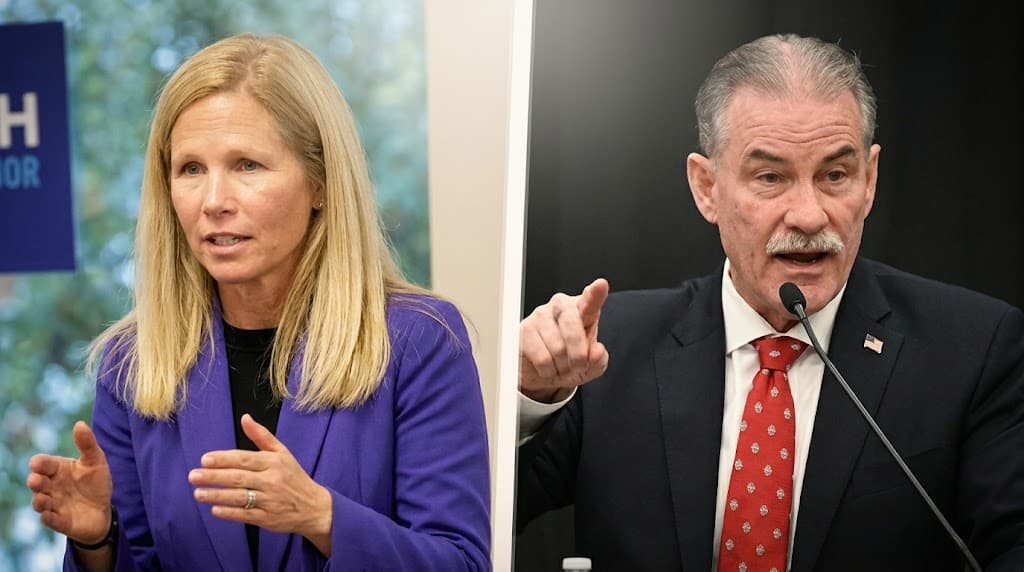


Jocelyn Benson leads John James across distinct Michigan surveys, but turnout assumptions complicate assessments of her gubernatorial advantage’s strength.
What to Know
- Jocelyn Benson led John James by 51% to 45% among likely voters in Marist’s October survey.
- Marist’s registered-voter results gave Benson a larger 53% to 42% advantage.
- An earlier YouGov survey found Benson ahead by 48% to 45% among likely voters.
- Marist applied a likely-voter weight rather than identifying a separate sample of 1,185 likely voters.
- Differences between these surveys do not establish that Benson’s lead increased.
Michigan’s governor polling presents a consistent direction but an uncertain margin. Democrat Jocelyn Benson led Republican John James in both the Marist and YouGov surveys examined here. The difference between their results does not establish how much voter preferences changed.
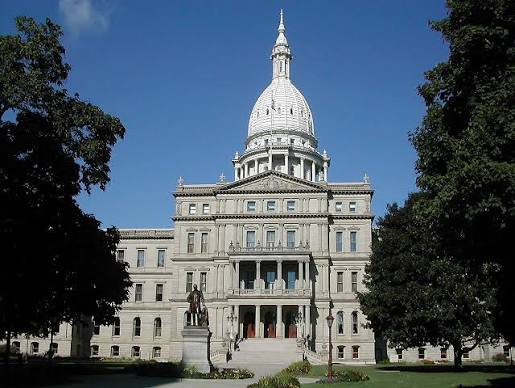
Michigan’s governor contest requires scrutiny beyond a single polling margin, via Antony-22, Wikimedia Commons.
The Marist Poll’s October Michigan release reported a 6-point Benson advantage among likely voters, compared with 3 points in an earlier YouGov survey. More importantly, Marist’s own registered-voter and likely-voter estimates differed substantially. That makes the assumed electorate central to understanding the race, not a methodological footnote.
Marist’s Voter Estimates Produce Different Margins
Marist interviewed 1,185 registered voters from October 15 through October 18, 2026. Its registered-voter result placed Benson at 53% and James at 42%, an 11-point advantage. Among likely voters, Benson received 51% and James 45%.
Those are different estimates from the same research, not separate polls showing movement. Marist’s methodology statement says it applied a likely-voter weight based on each respondent’s estimated probability of voting. Describing the entire sample as 1,185 likely voters would therefore obscure how the published estimate was produced.
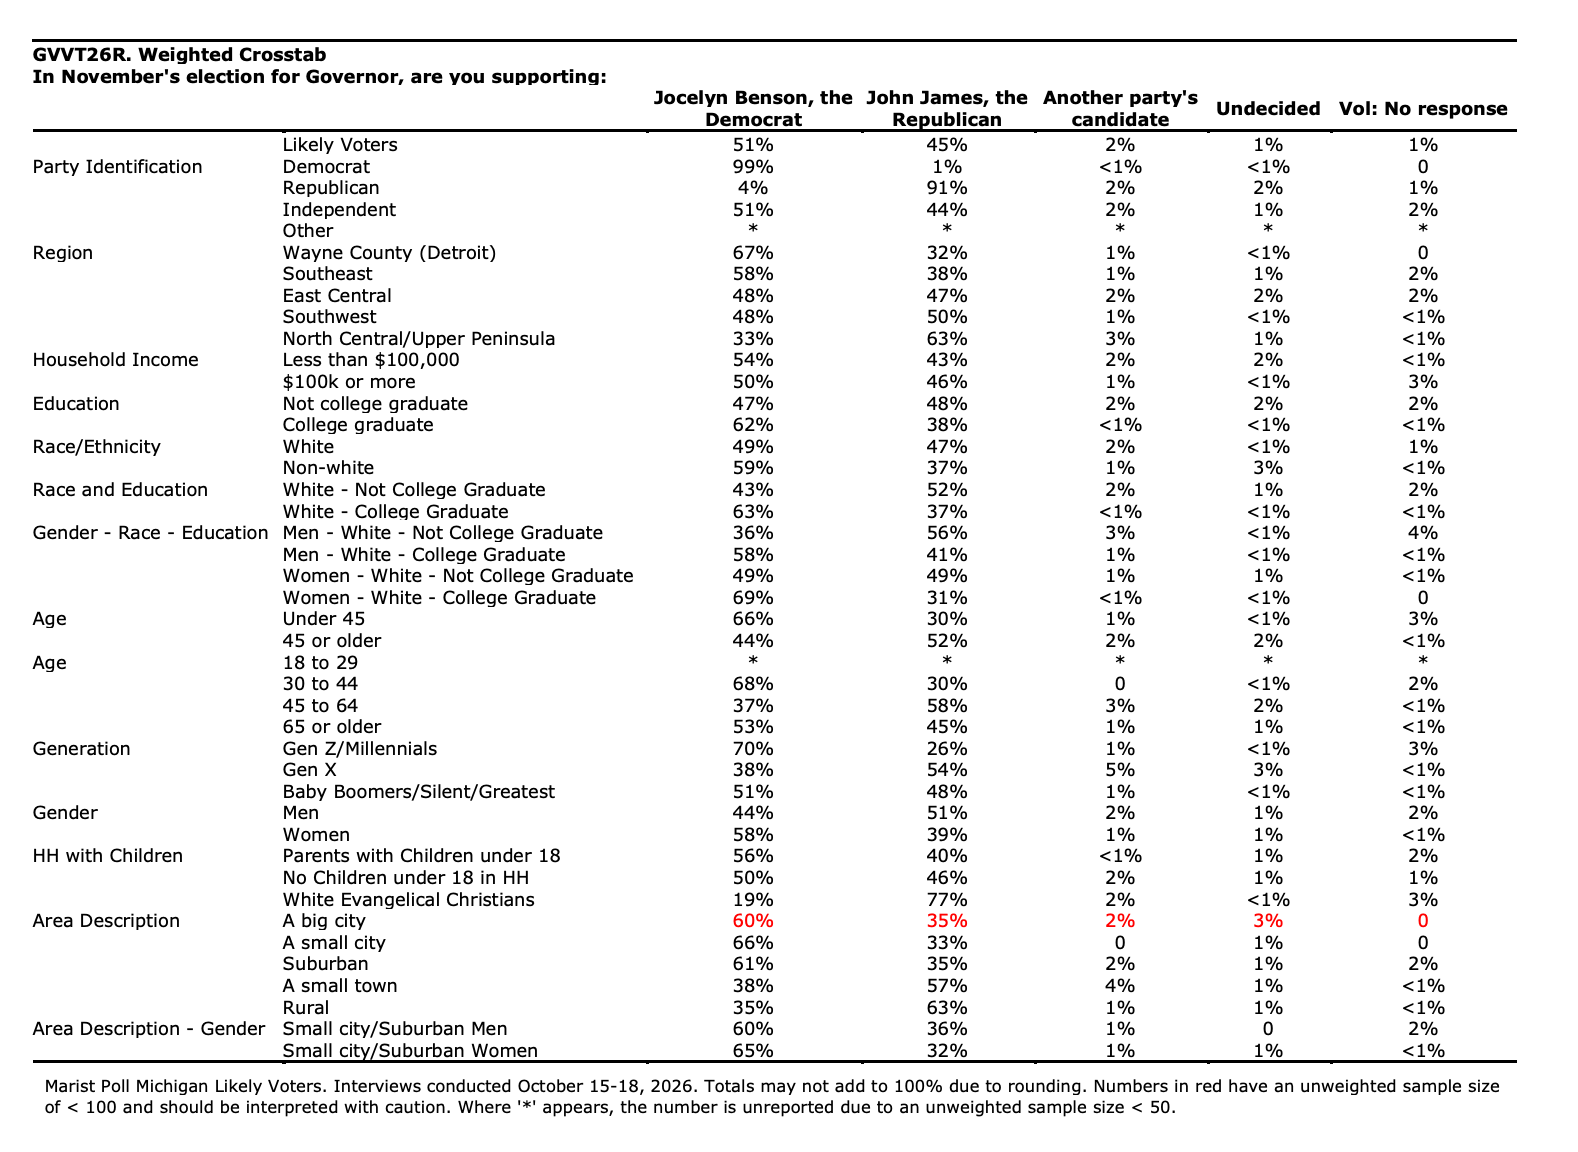
Marist’s likely-voter estimate places Benson ahead without guaranteeing the outcome, via Marist Poll.
Marist used live telephone interviews, text contact and online research. Its reported uncertainty was ±4.0 percentage points for registered voters and ±4.3 points for likely voters. The methodology incorporates the effects of weighting into those calculations.
The political implication is straightforward: measuring support among registered voters and estimating support among people expected to vote are not interchangeable tasks. Benson’s advantage was smaller under Marist’s likely-voter weighting. That does not mean she lost those voters during the interviews or that every registered voter excluded from a turnout estimate preferred her.
Turnout assumptions matter to both campaigns. Benson’s stronger registered-voter result cannot substitute for participation, while James’s improved position in the likely-voter estimate does not place him ahead. Neither finding proves that one campaign’s mobilization operation is outperforming the other.
YouGov Confirms the Direction, Not a Trend
YouGov’s original Michigan results cover September 22 through October 4, 2026 and identify 3,949 likely voters. Benson received 48%, James 45%, someone else 2% and undecided 5%. Its governor question adjusted the wording according to respondents’ stated likelihood of voting.
Those dates matter because the survey ended before Marist began interviewing. But chronological order alone does not make the two releases a tracking series. Different respondents, recruitment procedures, weights and question formats can produce different results even without a real change in underlying preferences.
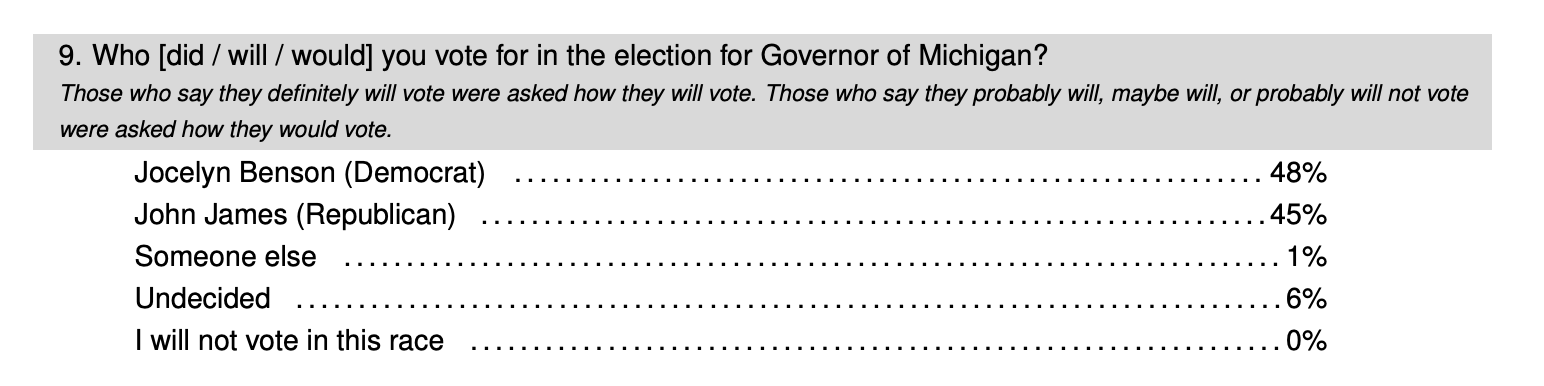
YouGov reports a narrower Benson lead and explicit undecided responses, via YouGov.
The shared James figure should not be mistaken for evidence that his support remained fixed. Likewise, the difference between Benson’s toplines does not establish a gain. The defensible conclusion is that both organizations measured a Benson advantage under their respective designs.
Sample size does not settle which result deserves more confidence. A larger survey can reduce some forms of statistical uncertainty, but it does not automatically correct an unrepresentative sample, inaccurate turnout assumptions or differences in question wording. YouGov’s larger respondent count is useful context, not a guarantee of greater accuracy.
Michigan’s Call the Map polling archive supplies broader context by listing additional surveys, their populations and source links. It also separates individual releases from its polling average. Neither an archive entry nor an average should replace the original documentation when identifying a survey’s sample or response categories.
These October findings are dated measurements rather than a complete account of the final electorate. Later surveys may add evidence, but their inclusion requires the same checks. A favorable sequence of toplines is not enough to establish momentum without examining comparability.
Sampling Error Does Not Directly Describe the Lead
A poll’s published margin of error generally accompanies an estimated share, not the difference between two candidates. The uncertainty around that difference depends on how the estimates relate to one another. Simply comparing a candidate margin with one published error figure can therefore produce a misleading claim of certainty.
Marist’s 6-point lead should not be described as securely established merely because it exceeds 4.3 points. Nor should that comparison alone be used to assign a precise probability that Benson wins. Such a calculation would require an appropriate statistical treatment and assumptions extending beyond a single ballot test.
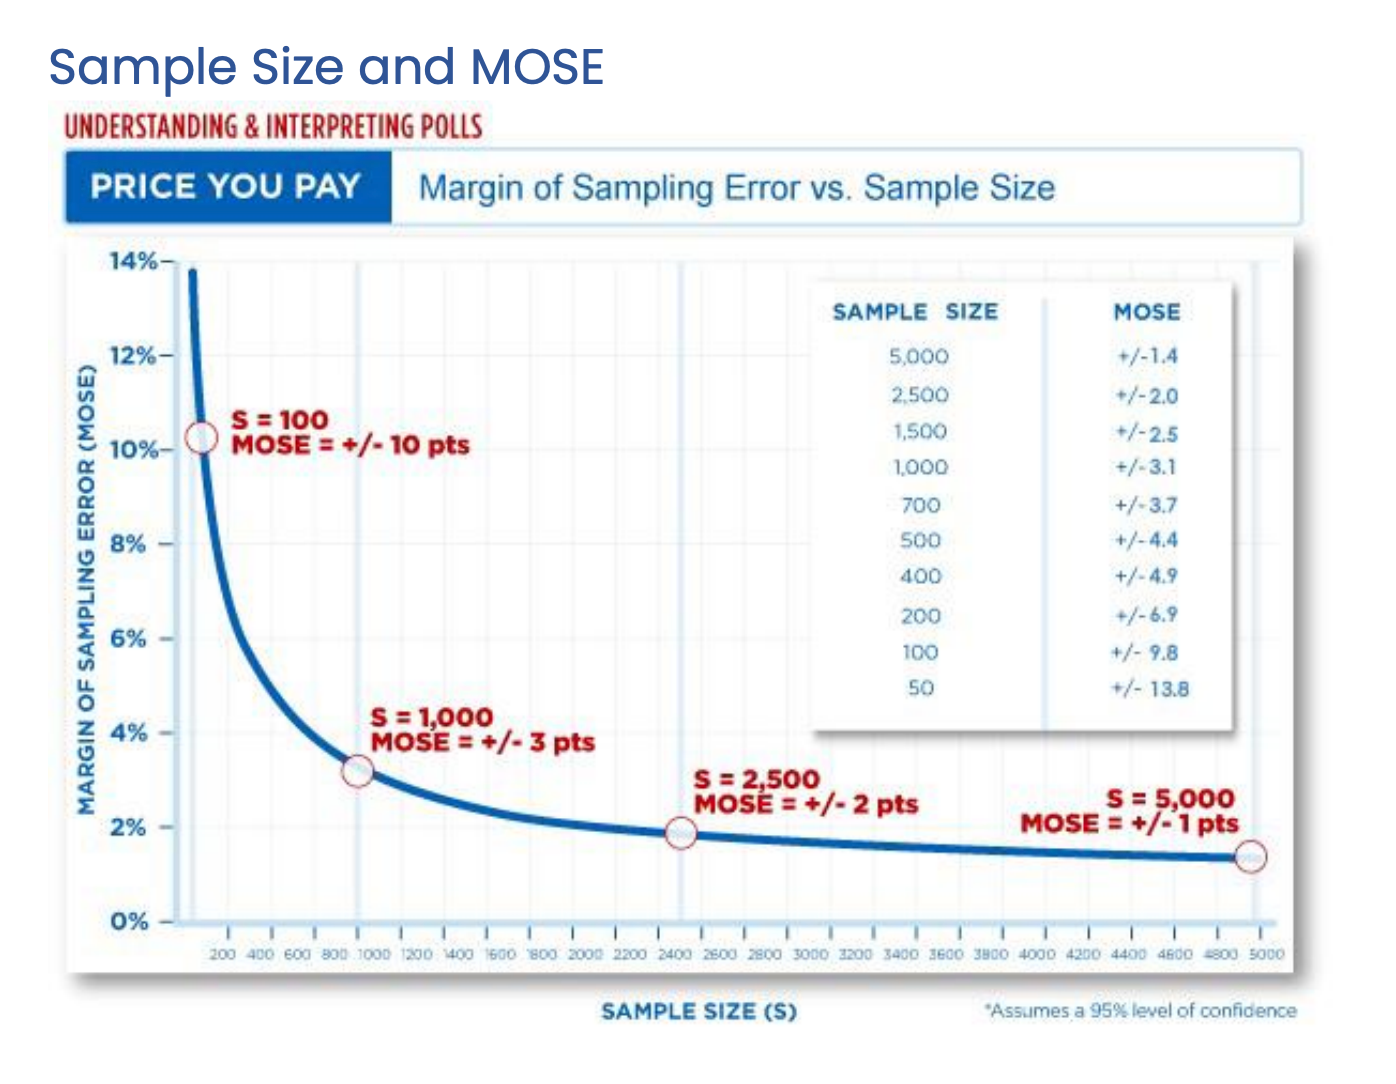
Sampling uncertainty requires interpretation beyond comparing two prominent polling numbers, via AAPOR.
Election outcomes introduce further uncertainty because polls measure responses during their field periods. Subsequent decisions and actual participation can differ from those estimates. The distinction keeps a measured advantage from becoming an unsupported victory prediction.
For Benson, the evidence supports a favorable position rather than complacency. For James, the narrower survey offers a competitive opening rather than proof that the larger lead is wrong. Both interpretations must remain accountable to the same methodological standards.
Wrap Up
Benson led in both surveys, making her advantage more than an isolated finding. Its size nevertheless varied across organizations and voter estimates. Those differences are part of the evidence.
Marist’s registered-voter and likely-voter results demonstrate why defining the electorate matters. YouGov provides an earlier comparison with a narrower margin. Neither comparison establishes movement by itself.
Michigan’s governor contest should therefore be assessed through both support and uncertainty. The measured advantage belongs to Benson. Its final electoral value depends on voters, not the apparent precision of a topline.