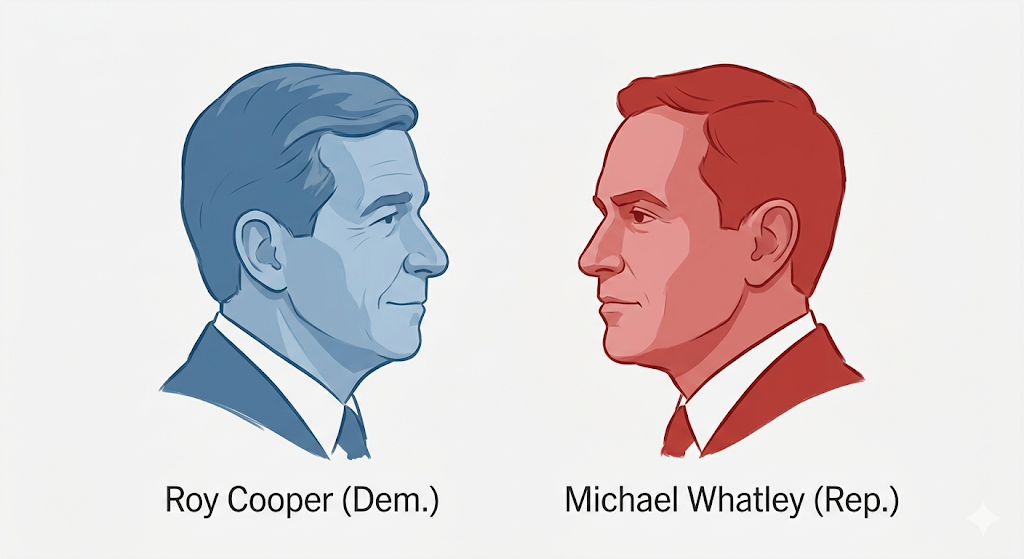


Roy Cooper’s repeated polling advantages put Michael Whatley under pressure without establishing an agreed margin or guaranteed Democratic pickup.
What to Know
- Harper measured Roy Cooper ahead of Michael Whatley by 49.4% to 39.1%.
- SurveyUSA reported a larger 54% to 40% advantage among likely or already-voted respondents.
- Trafalgar’s original figures placed Cooper at 48.8% and Whatley at 40.9%.
- Elon’s initial likely-voter question gave Cooper 52%, compared with Whatley’s 39%.
- Agreement on the leader strengthens the evidence of an advantage without fixing its size.
October’s North Carolina Senate polling presents a clearer answer about the leader than the margin. Democrat Roy Cooper led Republican Michael Whatley in surveys from Harper, SurveyUSA, Trafalgar and Elon University. The repeated finding makes the race harder to explain away as one unfavorable poll.
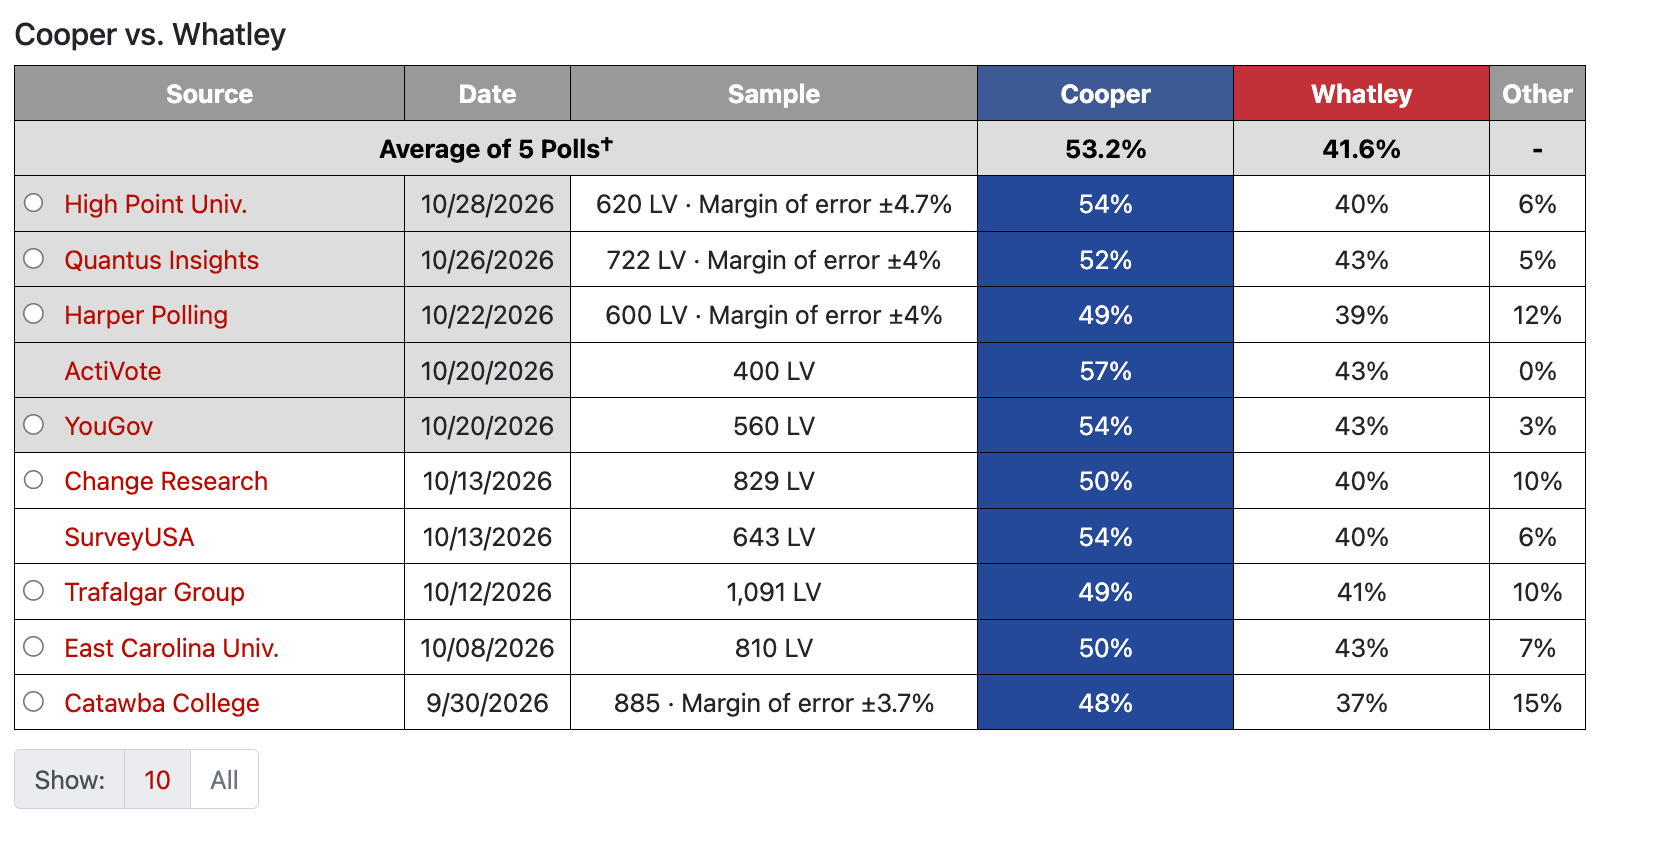
Separate October surveys repeatedly place Cooper ahead in North Carolina, via 270toWin.
The Carolina Journal/Harper results added another Cooper advantage later in the month. But the surveys differ in field dates, respondent selection and ballot-question design. Their agreement supports a measured Cooper lead, not an assumption that the final margin must resemble any particular release.
Harper Reinforces a Pattern Rather Than Establishing a New Trend
Harper interviewed 600 likely voters from October 18 through October 20, 2026, using live telephone and SMS-to-online interviews. Its multi-candidate Senate question recorded Cooper at 49.4% and Whatley at 39.1%. The exact margin was 10.3 percentage points, commonly rounded to a 10-point advantage.
SurveyUSA’s WRAL/WSOC survey found Cooper at 54% and Whatley at 40%. Interviews ran from October 7 through October 11, with 643 respondents classified as likely voters or people who had already voted, drawn from 900 adults. Its reported credibility interval was ±5 points.
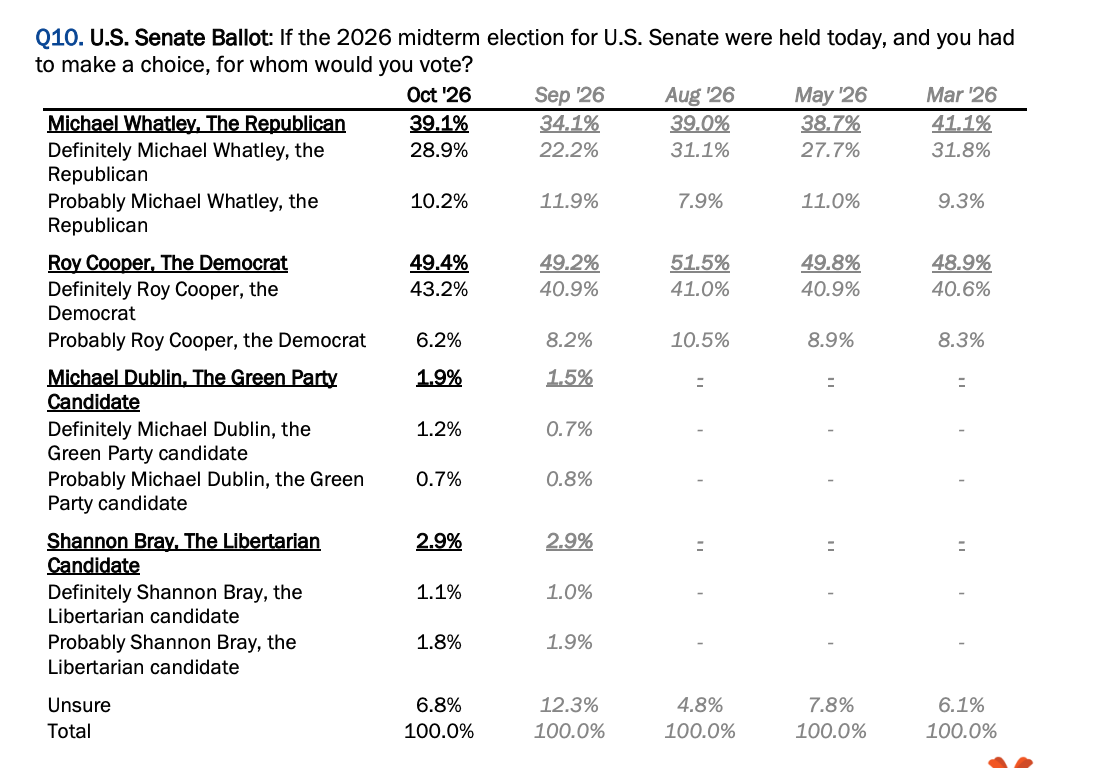
Harper’s detailed ballot table distinguishes candidate support from remaining uncertainty, via Carolina Journal/Harper Polling.
Trafalgar’s original report covered October 8–10, with 1,091 likely general-election voters and a reported sampling error of ±2.9 points. Its exact candidate shares were 48.8% and 40.9%, a 7.9-point Cooper lead. Rounding those figures to approximately 49% to 41% preserves the broad result.
These are separate measurements, not a sequence proving that Cooper rose or fell. SurveyUSA and Trafalgar interviewed during overlapping periods yet produced different margins. Harper’s later result cannot resolve whether those differences came from sampling variation, methods, question design or actual changes in preferences.
The common finding is nevertheless consequential. Cooper led under each organization’s approach. Whatley’s deficit therefore requires an explanation broader than dismissing a single pollster’s result.
Elon Shows Why the Ballot Question Matters
Elon’s October release fills an important gap in the comparison. Its initial likely-voter result put Cooper at 52%, Whatley at 39%, undecided at 6% and other candidates or someone else at 3%. That produces a 13-point advantage without treating every remaining respondent as undecided.
The university’s survey ran from September 29 through October 8, although publication came on October 20. YouGov fielded the online research for Elon, matching respondents down to a final dataset of 800 adults. That overall sample must not be described as 800 likely voters.
Elon reported likely-voter uncertainty of ±4.9 percentage points. Its release also disclosed a second question pressing undecided respondents to choose. Under that version, Cooper received 54% and Whatley 43%, reducing the margin to 11 points.
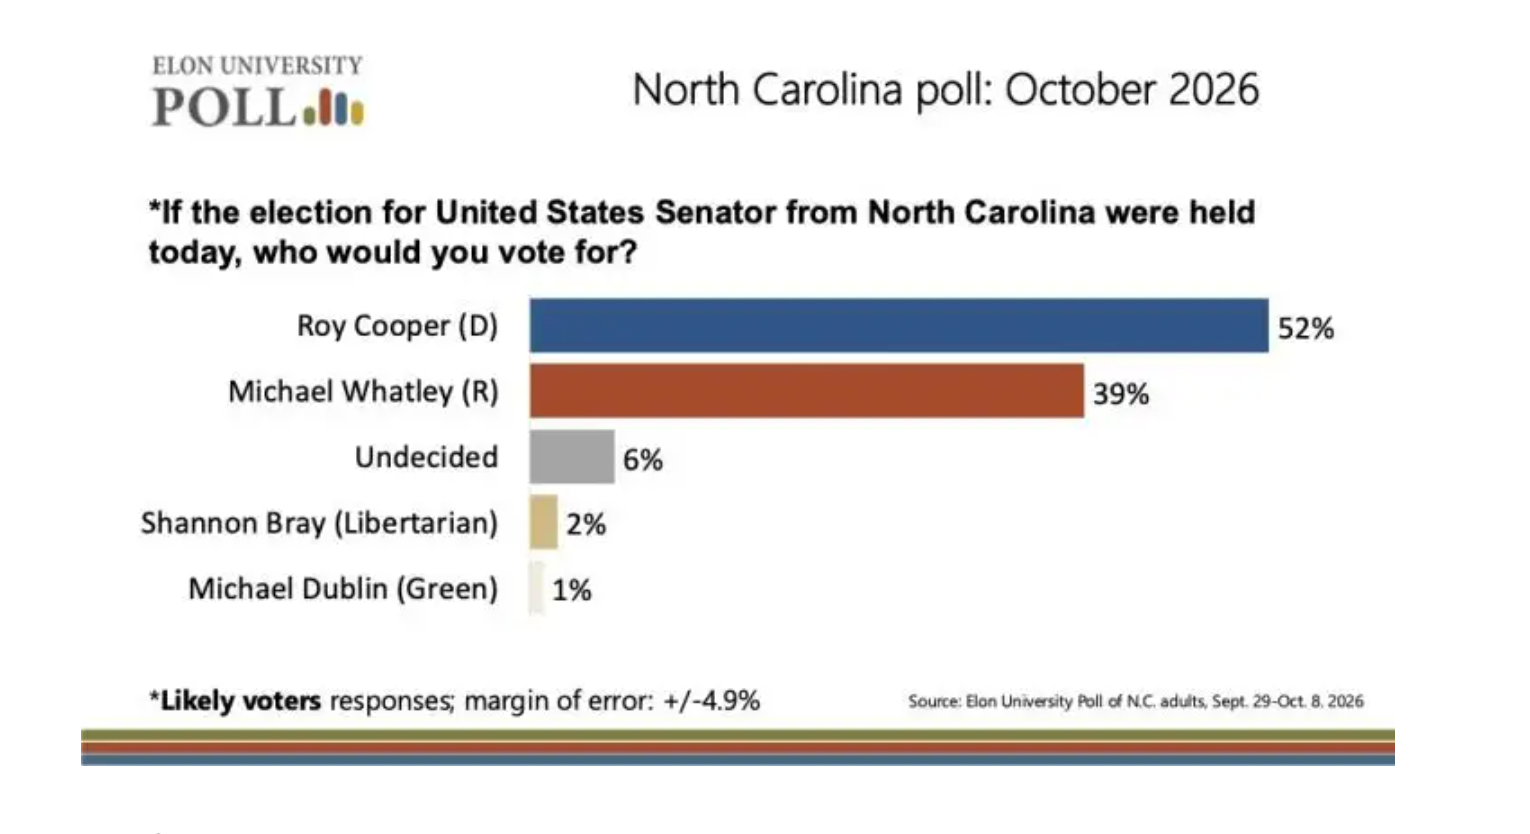
Elon’s initial ballot question preserves undecided and alternative candidate preferences, via Elon University Poll.
That difference demonstrates why identical candidate names do not make ballot tests interchangeable. A forced-choice result answers a different question from one allowing respondents to remain undecided. Comparing them without labels can create apparent disagreement that partly reflects reporting conventions.
Harper likewise published both multi-candidate and head-to-head results. Its direct Cooper–Whatley question produced 51.6% to 42.0%, compared with the smaller combined major-party share in its initial ballot test. Neither version should silently replace the other in a comparison table.
Sponsorship and disclosure deserve the same precision. SurveyUSA’s research was commissioned by WRAL and WSOC-TV, while Elon states that its polling is university-funded. Harper’s documentation and Trafalgar’s report should be evaluated on their disclosed methods rather than assumptions based solely on institutional reputation.
Consistency Strengthens the Signal Without Removing Risk
A cross-pollster advantage is more informative than an isolated release, but it is not independent proof of accuracy. Pollsters can share difficulties reaching voters or estimating participation. Several organizations can therefore agree and still miss in the same direction.
The RealClearPolling comparison and Call the Map archive help readers inspect the broader record. Their averages remain distinct from the individual surveys underlying them. Inclusion in an archive does not erase differences in population or questionnaire.
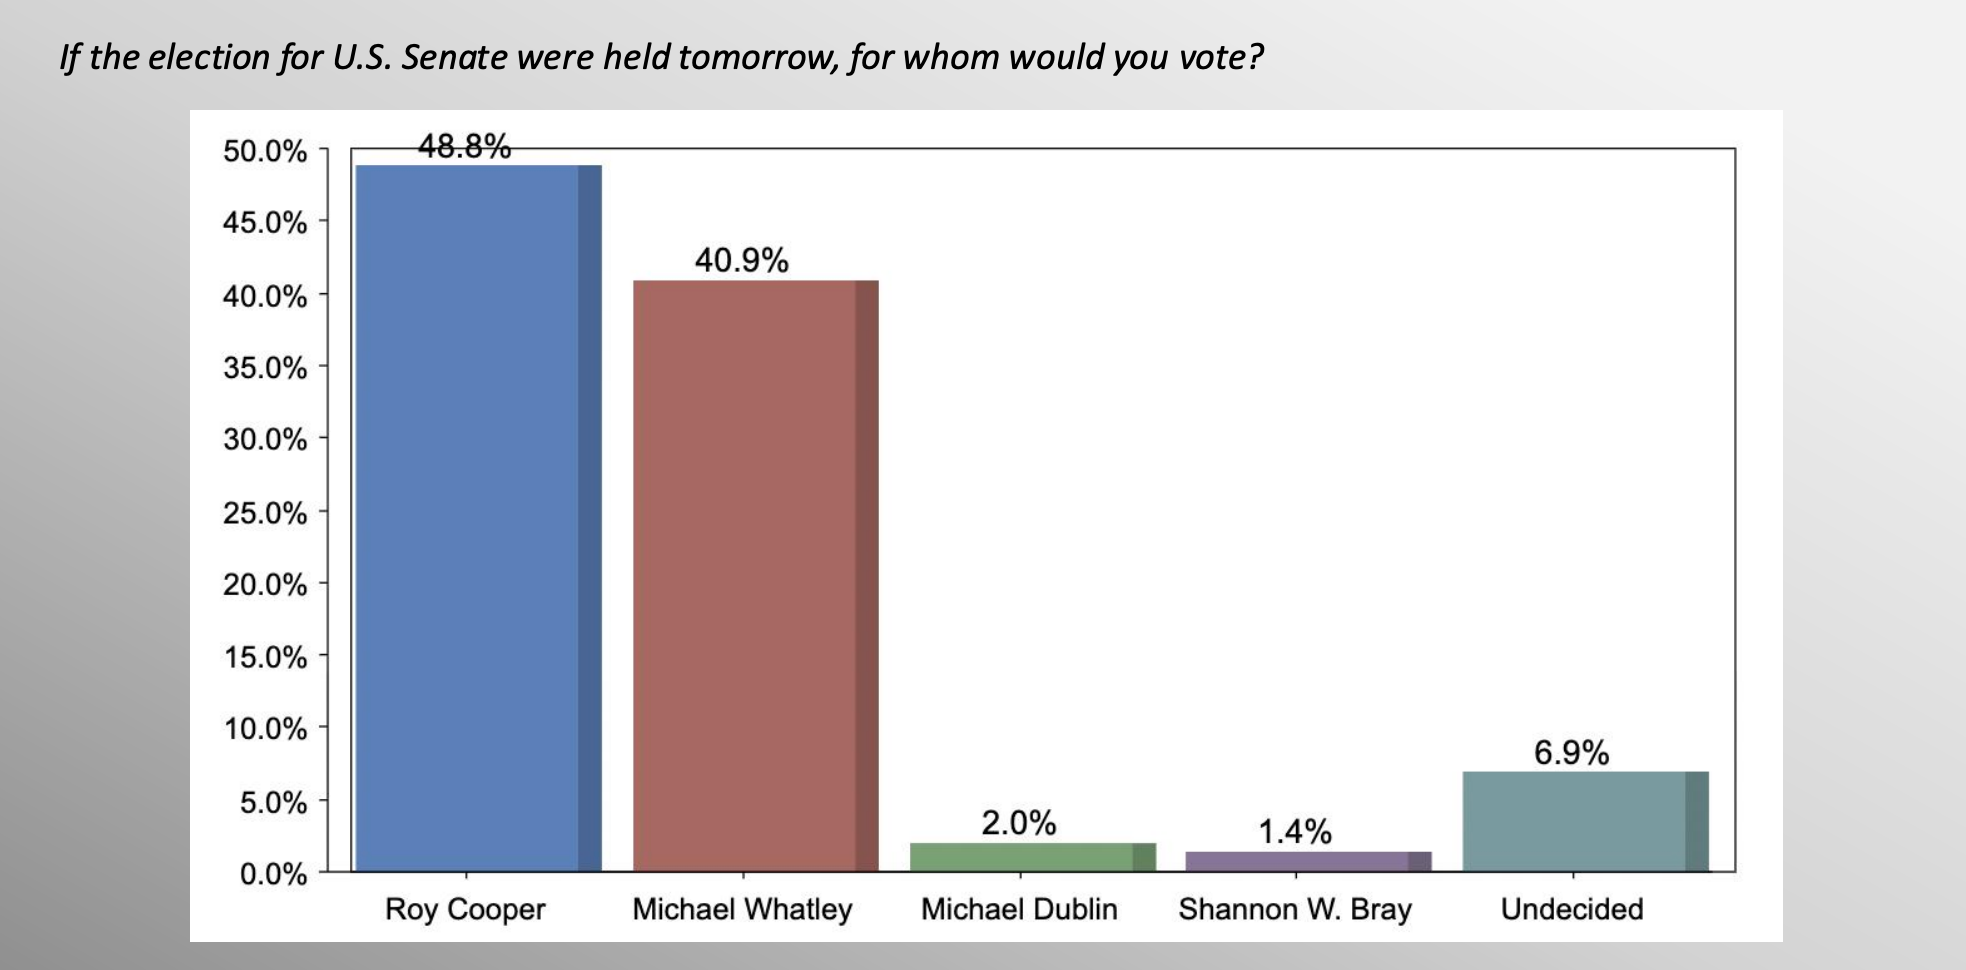
Trafalgar also finds Cooper leading while reporting a narrower advantage, via Trafalgar Group.
For Cooper, repeated leads indicate a favorable position rather than a completed election. For Whatley, the challenge is that the unfavorable evidence extends across multiple research organizations. Neither conclusion identifies which campaign expenditure would change the result or proves that donor decisions were caused by polling.
Published uncertainty also requires restraint. A candidate’s margin of error is not automatically the margin of error for the difference between candidates. Polling estimates should inform the assessment of the race without becoming unsupported win probabilities.
Wrap Up
Cooper led across the October surveys examined here. The margins differed, but the direction did not. That is the strongest shared finding.
Question wording and voter definitions explain why the releases require separate labels. They do not establish a complete explanation for every numerical difference. Nor do they turn cross-pollster comparisons into a tracking series.
North Carolina consequently presents evidence of a sustained measured Cooper advantage. Its exact size remains uncertain. Election Day will test whether that polling pattern translates into the final electorate.